|
HKL-2000 Online Manual |
||
|
Previous Appendix: Installation |
Table of Contents | |
Appendix - Trouble Shooting
When refinement goes wrong
Occasionally the auto-indexing routine does not give clear-cut results. There are four classes of data-reduction problems:
1. Utter failure
2. Misprediction
3. Kind-of-failed
4. The predicted positions agree perfectly with the peaks, but the data scale poorly
1. Utter failure means that there is no reasonable predicted lattice, the crystal unit cell parameters are unreasonable, and the predicted diffraction pattern does not correspond to the observed image. In most cases, failure can be ascribed to problems in three areas:
A. experimental conditions,
B. auto-indexing parameters, and/or
C. the peak search (rarely).
A. Experimental conditions that can cause indexing failure: Problems with experimental site parameters account for the vast majority of the problems with auto-indexing single-crystal data. If any of the following parameters is widely off, your auto-indexing will also be off (listed in order of importance):
i. The x beam and y beam positions. The error of the direct beam coordinates should be less than half of the distance between the closest diffraction spots; therefore, small unit cells are more forgiving about beam position errors.
There are several methods of setting the x beam and y beam positions. The simplest is to measure the coordinates directly from the Image Display. The position of the cursor is displayed in the little green box on the right. The best case for this is if the beam stop permits a tiny amount of the direct beam to pass through and make a spot on each frame (Figure 124), but this method can also be used if you have a combination of a small beam stop and a relatively small unit cell. After determining the position of the direct beam with the cursor, it can either be entered using the Site Configuration dialog (Figure 14) or using the window launched by the Set Beam Position button (Figure 125).
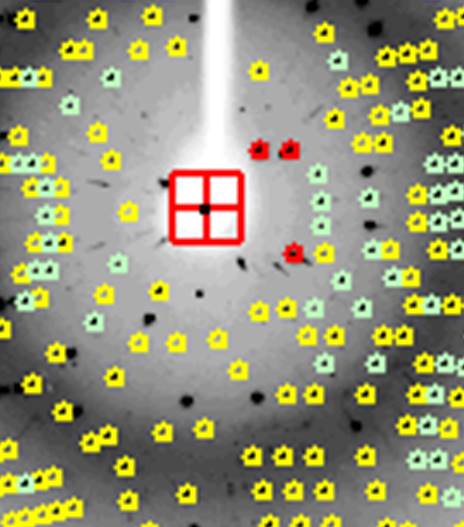
Figure 124. The beam stop thinned in the center shows the direct beam position.
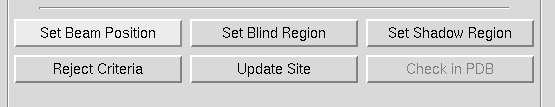
Figure 125. The Set Beam Position button opens the beam position dialog.
The set beam position dialog (Figure 126) provides an interactive method of setting the direct beam position. Clicking on the big blue square will activate the cursor such that the coordinates of wherever you click in the main Image Display window will be entered into the fields for the new X and Y Beam Positions. At this time, only the main Image Display window is active for this operation, not the Zoom window. These new positions will take effect after you click on the button that says apply current. Clicking here does two things. First, it enters new Beam Position coordinates into the refinement, and second, it gives a go command to Denzo, which starts the refinement (equivalent to clicking the refine button). This allows you to see the effect of the new Beam Position on the predicted reflections right away. (You may have to click Abort Refinement and try to Index again.) You can also enter these new values into the Site Configuration file by clicking the update site button. However, just as with the Site Configuration dialog, you can only update the site if you have permission to write to the site definition file. Even if you do not update the site file, the new beam coordinates will be in use until you close the program. If you think that the beam position has changed, it may be prudent to create a new site with the updated beam position.
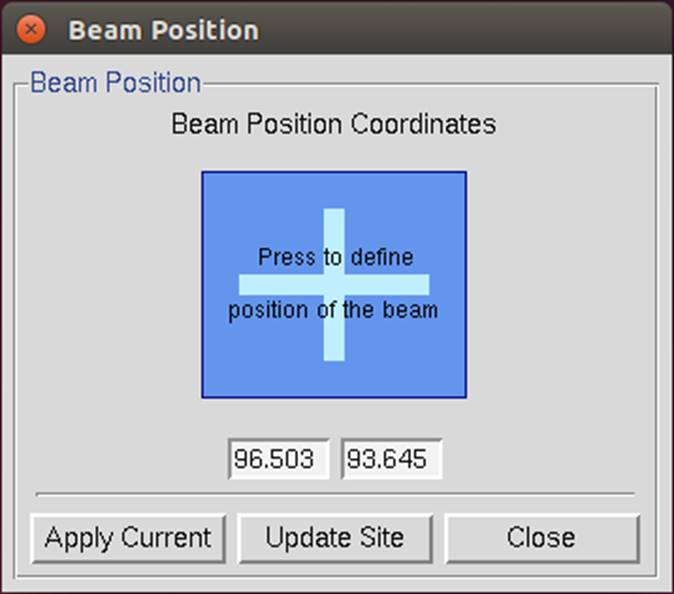
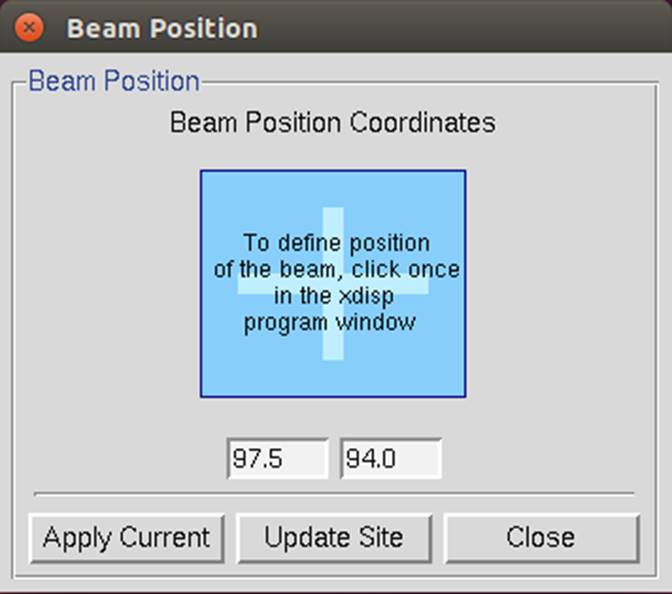
Figure 126. The Beam Position Dialog in the normal and activated state.
ii. Specification of the detector format (believe it, it's happened).
iii. The crystal-to-detector distance. The distance should be known accurately (within about 1%) and can be measured with a tape measure as a last resort.
iv. The Detector Rotation X and Detector Rotation Y values. Misset Detector Rotation X and Detector Rotation Y values may be due to 2Θ angles other than zero.
v. Oscillation range. Very rarely auto-indexing will fail because too large or too small an oscillation range was collected. In the case of large oscillations, the lunes may severely overlap, and the auto-indexing program will have a problem with the non-uniqueness of the mapping from the detector to reciprocal space. In the case of small oscillations or stills collected on non-mosaic crystals with a very parallel beam, too few reflections may be present to describe a lune. As a rule of thumb, the following types of oscillation ranges should be used:
viruses: 0.25o oscillations,
proteins: 1.0o oscillations,
small molecules: 2.5o - 5.0o oscillations
There is a fairly wide margin on either side, by at least a factor of 2. The main determinant of the oscillation range is whether or not the diffraction spots are well resolved.
Knowing the detector parameters only makes sense. If you want to deduce some unknowns (crystal lattice, cell and orientation parameters), you need some "knowns" too.
B. Auto-indexing parameter causes of indexing failure: Before auto-indexing Denzo edits the peak list produced by the Peak Search algorithm of the XdisplayF program. Problems with the auto-indexing parameters account for a few of the remaining problems with auto-indexing. These may have to be adjusted in the case of non-single crystals, very large or small unit cells, lots of noise peaks, or ice rings. These parameters (with the Denzo keywords in parentheses) are the longest vector (longest vector), resolution limits (resolution limits), refinement sigma cutoff (weak level), integration box size (box) and integration box spot size (spot). All of these parameters except for the longest vector can be changed through the HKL-2000 window (the longest vector may be changed via a macro on the Macros tab).
i. The longest vector may need to be adjusted if the peaks are sparse due to a small unit cell or low mosaicity. In this case, it should be set to equal the longest vector of the reduced primitive real space unit cell. If you did not understand that last sentence, simply use the longest unit cell axis (which is the same in primitive space groups, anyway). Better to err on the side of larger rather than smaller values.
ii. Resolution limits can be adjusted, if you have:
An ice ring, which interferes with the indexing. You can set the resolution limits to, say, 100 - 4.0 Å to eliminate these reflections.
A small satellite crystal, which contributes some reflections at low resolution but not at high resolution. You can set the resolution limits to, say, 8 - 2 Å, thereby excluding the strongest contributors from the contaminating lattice.
A cracked crystal, where the two lattices are the same space group only 2-3 degrees apart. You can often adjust the resolution limits, as in the case of an ice ring, so that you index at low resolution, where the two lattices are approximately identical and then use manual refinement to zero in on both lattices. The idea here is to index each lattice separately and to combine the data later in Scalepack.
A twinned crystal, where the two lattices have a non-random orientation relative to one another. The program may fail spectacularly by finding a "superlattice," which indexes both lattices simultaneously but cannot be used to integrate the data because the superlattice does not usually fit both lattices exactly. Then it's time to call an expert or grow new crystals.
iii. Resolution sigma cutoff. If you have a number of spurious peaks the image distributed randomly over the image, you can adjust the value of the resolution sigma cutoff. This will affect the number of peaks accepted by the auto-indexing routine. By increasing the resolution sigma cutoff, you can exclude weak, spurious peaks, then run auto-indexing, and examine the superimposition of the auto-indexing predictions (green circles) on the image. If most of them cover real reflections and not noise, then you are succeeding.
iv. Box and spot sizes may have to be adjusted if too many spots are being removed by the overlap or background rejection criteria. Auto-indexing does not use spots which Denzo determines are overlapping.
C. Peak search causes of indexing failure. Finally, you can try changing the number of peaks you select in the peak picking routine. However, since Denzo edits the list of peaks anyway, this is unlikely to yield much improvement if the suggestions above do not work. In that case, do you have a better crystal?
2. Misprediction results in the location of reflection masks not corresponding to the positions of the Bragg peaks. It is visibly obvious and is disastrous. It may be due to:
Mis-indexing,
Forcing the wrong space group symmetry, or
Serious detector misconfiguration or malfunction.
Mis-indexing causes of mispredictions. Auto-indexing is based on the assumption that the diffraction spots are correctly mapped from detector coordinates to diffraction (reciprocal) space. The origin of the diffraction space is defined by the position of the direct beam on the detector. A substantial error in the beam position can shift the indexing of the diffraction pattern by an integer vector. Such misindexing can be totally self-consistent until the stage when symmetry-related reflections are compared. For any assumed (starting) value of the beam position, the origin of the diffraction space during indexing will be shifted to the nearest grid point of the best primitive lattice. An initial error in the direct beam position by 0.48 times the distance between reflections will lead to correct indexing, while an error of 0.52 times the same distance will cause a misindexing of the diffraction pattern by one index. Misindexing by one is never corrected by the subsequent refinement of the crystal and detector parameters. Misindexing often produces a poor agreement between the predicted and the observed positions of the reflections, but for some crystal orientations, the agreement between the predicted and the observed positions can be equally good for both correctly indexed and misindexed cases. This property of the diffraction geometry creates a potential trap for the unwary crystallographer.
Sometimes the crystal's asymmetric unit may have molecules related by an approximate translation by a fraction (typically one half) of a unit cell edge or diagonal. The resulting diffraction pattern will have odd index reflections much weaker than even index reflections. Auto-indexing may find one of the two possible solutions, the choice depending on whether odd reflections are weak enough to be assumed (within experimental error) systematically absent or not. This depends on the fraction of odd reflections in the peak search. If there are only a few odd reflections, then most of the peak search result may be explained with a smaller real-space unit cell. To prevent auto-indexing from finding such a smaller cell, you should enhance the fraction of odd reflections used in auto-indexing by changing the peak-search criteria or by using only high-resolution reflections in auto-indexing. If you still cannot index odd reflections, then you should consider ignoring them altogether. In such a case, you can solve the structure in a smaller unit cell, and the resulting structural error will not be very significant if odd reflections are much weaker than even ones.
3. Kind-of-failed means that a lattice other than primitive triclinic was predicted, but it had a relatively high distortion index, say 1-1.5%.
This may not be a "failure" but simply an indication that further refinement of parameters is needed, because the initial detector parameters in the Site Configuration were very far off. You should just run a few cycles of refinement in P1 and change Bravais Lattice. Unfortunately, misindexing may give similar results. A quick check of the superposition of the predicted spot positions on the reflections should tell you if the refinement is likely to succeed. Note that refinement may converge to low χ2 values even with misindexed crystals, but eventually the problem will surface and you will have to index correctly. This is now less of a problem with the 3D Window option because the requirement to integrate with consistent values over a range of frames is much more stringent a test. You are much less likely to refine misindexed data to low χ2 values using a multiple-frame 3D Window.
Incorrect parameters in the Site Configuration can cause predictions to not line up with the reflections. For example, the spindle rotation direction, or even orientation, may be specified incorrectly or the Frame Width. An easy way to test for this is to reduce the size of the 3D Window from 5 frames (the default for CCD detectors) to 1 frame, hit REFINE, and note the χ2 values again. If they improve (move closer to 1.0 and change to green in color) this tells you that there is a problem with specifying the relationship between successive oscillation frames.
Two parameters affect the relationship between successive frames:
a. The most likely candidate is an incorrect Frame Width (perhaps the header was written incorrectly). This can be changed in the Frame Geometry panel of the main page.
b. A second candidate, especially with data collected from customized goniostats, is that the spindle rotation direction is incorrectly specified. To change the goniostat misalignment parameters, go to the Site Configuration box and change the sign of the motor axis value. For example, if the axis is specified as 0 1 0, you could try changing it to 0 - 1 0. Changing the order of the numbers, e.g., to 1 0 0 means that you are specifying a different rotation axis orientation, a severe error
4. Predicted positions agree perfectly with the peaks and no detector or diffraction artifacts are visible, but data scale poorly and produce many outliers. This problem may be either a simple mistake in data processing (such as using the wrong file format or wrong goniostat definitions) or a non-uniform exposure during crystal oscillation.
The non-uniform exposure may be caused by spindle motor backlash, shutter malfunction (opening too early or too late), ionization chamber electronics failure (if used), decay or variation of the X-ray beam intensity (if an ionization chamber is not used), variable speed of the spindle motor, etc. Non-uniform exposure is best diagnosed by exclusion of other problems that may affect data quality. Graphical feedback provides confidence that the problem cannot be at the indexing/integration stage.
Large variations in absorption of X-rays by the crystal will make data scale poorly and will produce a visible variation of the background; however, it will not affect positional agreement. The variation in the absorption can be avoided easily by properly mounting the crystal. The correction for absorption is a whole field in itself.
Errors in detector orientation will produce a distorted mapping from the detector to reciprocal space. A wrong crystal-to-detector distance will increase (or decrease) the apparent reciprocal space separation between Bragg peaks. This error will not be uniform in three directions; in the first approximation, along the beam direction the error will be proportional to the square root of the error in the distance, and in the other two directions the error will have linear dependence. In most cases, a significantly wrong crystal-to-detector distance (say an error of 10%) will not make the auto-indexing step fail immediately; however, the calculated unit cell will be quite wrong. The length of the unit cell along the beam direction will be 5% shorter, in the perpendicular directions 10% shorter. If the crystal is diagonally oriented (no principal axis along the beam direction) than the apparent angles between axes will violate the lattice symmetry. Incorrectly defined angles between the detector and the beam will result in incorrect angles between crystal axes. Therefore, the interpretation of the lattice symmetry is dependent, to some extent, on how precisely the detector position parameters are known a priori.