|
HKL-2000 Online Manual |
||
|
Previous Strategy & Simulation |
Table of Contents | |
Integrating All Frames
The Integrate button is red. Is this a problem?
The lettering in the button should be colored green. If it is orange, that means that either the &chi2 values are suspiciously high and should be checked, or else you have failed to select a lattice other than primitive triclinic. If the lettering is red, this warns you that the &chi2 values are unacceptably high and should be investigated (Figure 81). You can continue, but there is probably a problem you will have to address it eventually.
![]()
![]()
![]()
![]()
![]()
![]()
Figure 81. The Integrate buttons colored green, orange, red
Integration
After indexing your data, you need to process all of the images to get a complete dataset, a process known as integration. There are two ways to start integration: clicking on the integrate button in the Index tab or the integrate button in the Integration tab. Monitor the progress of the integration by examining the &chi2, Cell Constants, Crystal Rotations, Mosaicity, and Distance vs. Frame plots, as well as the agreement between the predicted reflections and the spots on each image. Ideally, all of these plots will yield horizontal lines, indicating little or no change of the refinement parameters for different 3D Windows in the data set.
The Crystal Slippage and Special integration buttons.
The Special radio-button opens up the command file used in the integration of the diffraction images. If you want to customize the integration settings passed to Denzo (for example, putting in many more "go" statements or some other modification to the standard procedure), this is the place to make those changes (Figure 82). You can also make these changes under the Macros tab in the HKL-2000 interface.
The Crystal Slippage button is a shorthand way of performing the integration in two resolution stages. The first stage is done at low resolution (4 Å) and then is expanded to the final resolution. Normally, integration is done to the highest resolution immediately. However, if the crystal is slipping in position during data collection, the crystal orientation parameters may not be consistent enough from frame to frame to process frames automatically. Using only the low order reflections at first allows a larger radius of convergence, which helps account for slipping crystals. Although crystal slippage is traditionally associated with capillary mounted crystals, it can occur even with cryo-mounted crystals. Sometimes liquid nitrogen can cause the glue or epoxy that keeps the pin in the base to come loose. Additionally, long, thin cryo loops have been known to bend from the pressure of the cryo-stream.
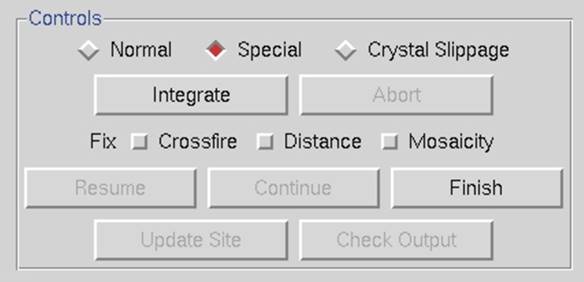
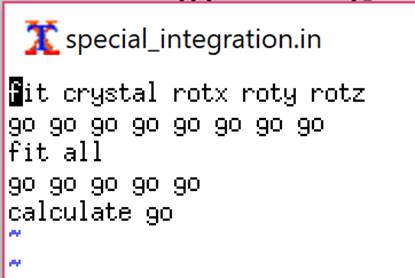
Figure 82. The special integration option and the default integration commands
Integration Information Plots
After starting integration, the display will change and present two graphs at the bottom of the tab. On the left is a mosaicity histogram refinement for the frame that is being refined; on the right is a graphical plot of the integration progress. The graph on the right, contained within the Integration Information plots, has radio button style selectors at the bottom that change the display between five different graphs &chi2, Unit Cell Constants, Crystal Orientation, Distance, and Mosaicity, each shown as a graph of the parameter vs. frame number. One of the most useful plots (diagnostically speaking) is &chi2 vs. Frame (Figure 83). Ideally, both lines (the positional &chi2 for X and Y) will be in the range of 1 to 2 over the set of processed images. All of the plots should be examined, with particular attention paid to detecting bad frames, which will show up as strong outliers in the Integration Information plots. All of the plots should be relatively flat as a function of frame number. You'll also notice that the points for each plot appear in bunches that correspond to the number of frames in the 3D window. If some frames in the &chi2 vs. Frame plot have unreasonably high &chi2 values, it makes sense to exclude those bad frames from scaling. Methods to do this are described below.
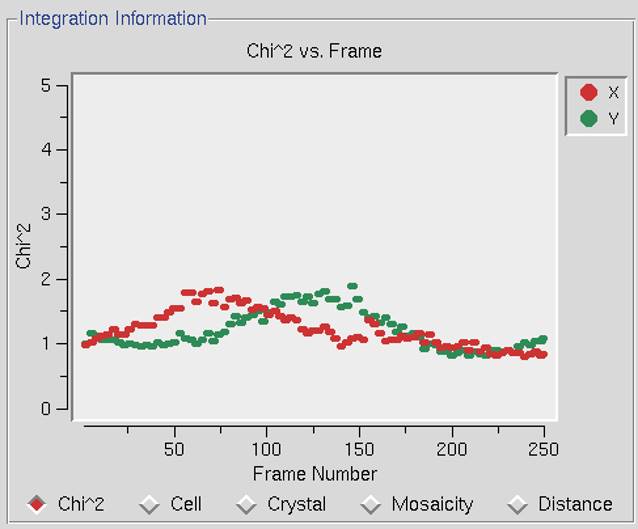
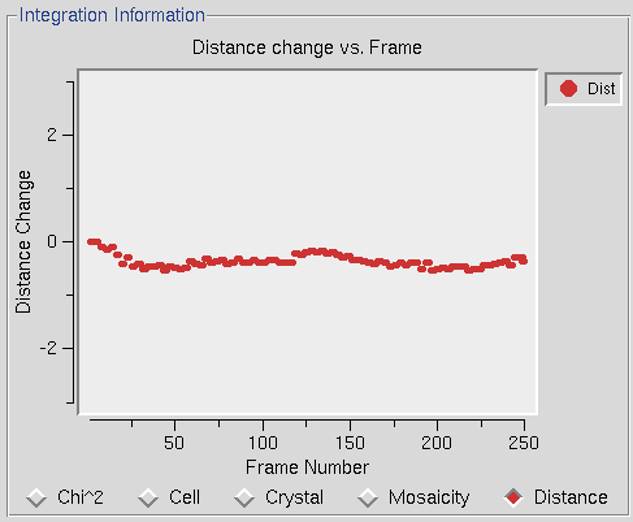
Figure 83. The diagnostic plots: &chi2 vs. Frame and Distance Change vs. Frame
What is an acceptable range for &chi2?
Ideally, the&chi2 and y values should be around 1 (i.e., colored green in the Refinement Information panel; see Figure 60). Sometimes they rise up into the 3 to 4 range. As the integration proceeds, the Image Display window will continually update. If the predicted reflections continue to superimpose on the observed reflections as the integration proceeds, then oscillating &chi2 values are no immediate cause for alarm. However, if the mosaicity values start refining to high values (greater than 2Å for frozen crystals), or the crystal orientation, cell, or distance parameters are changing dramatically, you should consider re-indexing or choosing another lattice. In some particularly problematic integrations, especially when the calculated unit cell parameters are changing substantially, you may try fixing the mosaicity by clicking the Fix Mosaicity button on the Controls panel (Figure 82). Fixing the mosaicity is particularly relevant for cases where there are several lattices in the beam at the same time. In the best-case scenario, only one of the lattices would dominate the diffraction pattern and be indexed, but sometimes as the crystal rotates other lattices become more prominent and the program may start to confuse them. By restricting the mosaicity, you may be able to effectively limit the number of nearby spots that can be included in the integration.
Drastically larger &chi2 values
Ideally, the &chi2 values will be close to 1, but values up to 3 and even 4 are sometimes normal and may not indicate a serious problem. However, &chi2 values that are off the plot that is displayed during integration (i.e.,>5) probably mean that something is wrong. The most likely culprit for otherwise "normal" data sets (i.e., where the diffraction pattern on the poorly indexed frames still looks normal, and there weren't any shutter or goniostat problems), is misindexing due to an incorrect X Beam or Y Beam value. Experimenting with different beam position values may solve the problem. This is relatively easy to do using the set beam position button found in the Index panel (described in the Troubleshooting Appendix). Crystal idiosyncrasies (such as slight splitting, which may not be apparent from an inspection of the diffraction images) or shutter, spindle or goniostat problems can also lead to high &chi2 values. Problems with the experimental setup will often manifest themselves suddenly, and a sharp change in the &chi2 values will pinpoint the frames that have been corrupted. It is always a good idea to verify the experimental setup by collecting a data set from a known, high-quality crystal in order to benchmark your setup.
The Mosaicity histogram
The mosaicity histogram reflects the reflections of the frame or of the frames of the 3D Window. The reflections are sorted into 20 zones, which range from plus or minus half of the input (or refined) mosaicity (Figure 84). Each zone represents the shortest angular distance of the center of the reflection from the surface of the Ewald sphere at the end of the oscillation range and is formally defined as the average observed partiality of the reflections in each zone. In other words, if, at the end of the oscillation range a particular reflection was -0.3Å away from (i.e., past) the surface of the Ewald sphere, then it would contribute to the 'bar' in the -0.3Å zone.
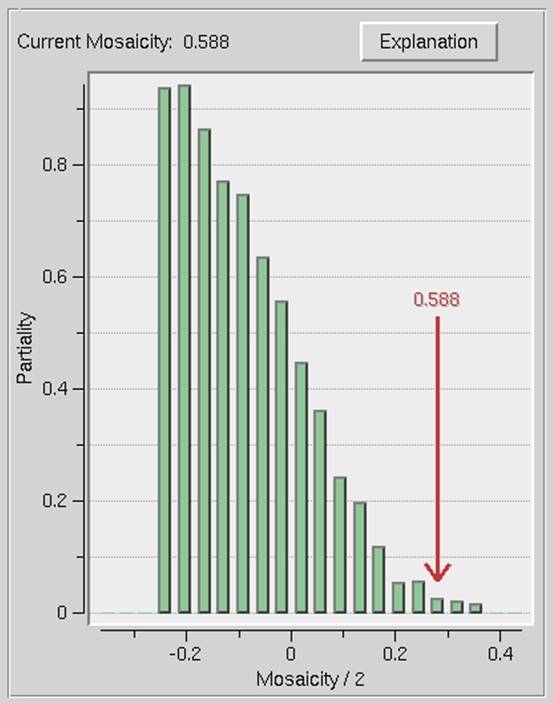
Figure 84. The mosaicity histogram
Only reflections that are single partials are included in the analysis. The thickness of the bars is proportional to the number of single partial reflections being integrated in the 3D Window. More reflections will lead to thicker bars. A reflection in negative zones means that the center of the reflection has already passed through the Bragg condition. In all cases, no matter what mosaicity you have input to Denzo, the histogram should pass through 50% in the zero zone. If the mosaicity you guessed was too small, then the histogram will not descend to zero at +mos/2. If the mosaicity you guessed was too large, then you will see a histogram which looks like a step function, falling to zero just past the zero zone.
If the mosaicity was chosen correctly or slightly overestimated (which is the preferred side to err on) the histogram will descend smoothly to zero at +mos/2. Frequently this is not the case and the histogram tails off due to the effects of diffuse scattering. If there are only a few reflections, the histogram may be quite choppy. The number of reflections can be increased by increasing the size of the 3D Window. If the histogram does not resemble any of the shapes mentioned here, it may be indicative of motor, spindle, or shutter problems.
How long should this take? How do I know if the program is stuck?
When the integration is complete, the display will show the message "Integration Complete." The speed of the integration depends on both hardware and data-specific factors. Among the hardware ones are CPU speed, amount of physical memory, and the speed at which the computer can access the raw data from disk (local disks are faster than remote ones). Data-specific factors include the number of observed and predicted reflections on each image, the size of each image file (larger frames take longer to read from disk), and the number of frames in the 3D Window (integrating 5 frames at a time will take about 5 times as long as integrating a single frame). For most modern computers and typical macromolecular data sets, this process usually takes 1-3 minutes at most. In my experience, if several minutes go by with no additions to the plots, something is probably amiss. The most likely culprit is slowness in reading the image files from disk, particularly if your frames are on a remote file server.
Waiting for image frames.
A very nice feature of HKL-2000 is the program's ability to wait for image frames during processing. This is indicated by the message "Waiting for Frames," which appears above the Integration Information window during integration (Figure 85). The program knows to wait for frames based on the value you entered in the Number of Frames entry of the Edit Set(s) dialog on the Data panel. For example, let's say you are collecting 60 images for a data set, but only 10 have been collected so far, and the others are on the way (e.g., are still being collected, read from the detector, being copied from a file server or CD/DVD, coming over FTP, etc.). When you first set up the data files, only 10 frames will be seen by the program. However, if you enter 60 for Number of Frames, the program will know that eventually 60 frames will constitute the complete set of diffraction images. You can start the indexing and integration, and these will proceed through the first 10 (or however many you have) frames currently on the disk. When those have been integrated, the message "Waiting for Frames" will appear. At this point, you don't have to do anything. As more frames appear, they will be automatically read and integrated. This allows you to monitor the progress of your data collection as it occurs. It also allows you to use your data collection time (e.g., at the synchrotron) more efficiently, by working on another task while you wait for integration to be completed. You can even proceed to scale the files that have been processed and monitor data collection as it happens, giving you the option of cutting data collection short if your crystal dies in the beam.
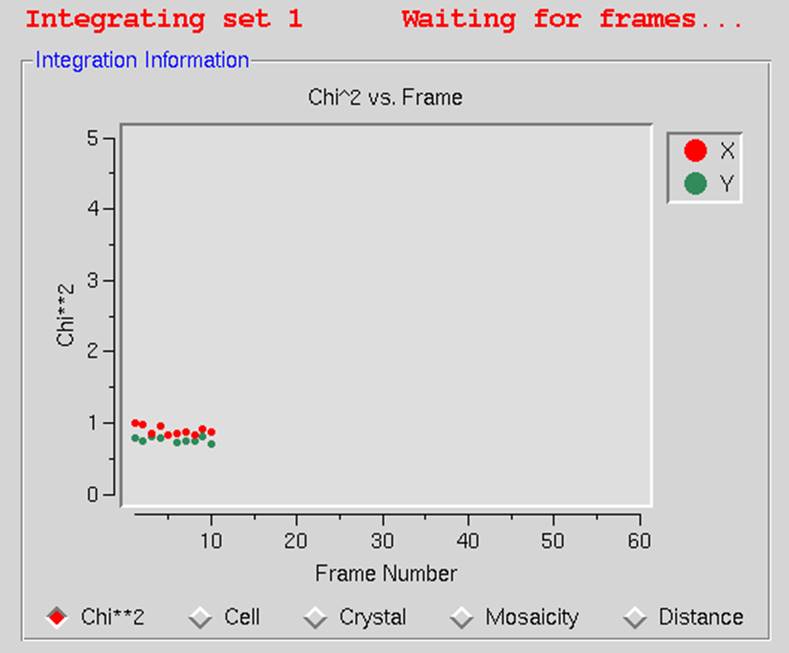
Figure 85. The program is waiting for new frames while processing the data
Updating the site configuration after processing data
Ordinarily, you would not update the site unless:
- you have the password to do so,
- the refined values of the site parameters (X and Y Beam Positions, Crossfire, Y Scale) are substantially different from the original site values, and
- the values you've refined are reliable.
Site parameters determined from weak, poorly diffracting crystals may not be much of an improvement (if at all!) from the default values. Generally, you want to use a superior-diffracting crystal to determine updated site parameter values.
How do I stop and start over?
To stop the integration hit abort, and you will get a message box with the question: "Which crystal orientation and cell parameters would you like to keep?" You can choose between three options: "original values" (values as read from the header of data files), "indexed values" (values after the last auto-indexing round), and "current values." Now you can reindex if you'd like.