|
HKL-2000 Online Manual |
||
|
Previous Output Statistics and Graphs |
Table of Contents | |
The Project Tab After Scaling
After scaling your data, the Project Tab will contain information about your scaled sets (Figure 106). A new set will appear every time you rename the output file. This can be useful if you are scaling the data in different space groups or want to check scaling results using different parameters.
If you have a different results file from a previous session (that was not saved to your project, you can load it here using the Add File button. Conversely, if you do not want to keep a file in you set history, you can use the remove file button. For example, if you have scaled the data in two data sets, you may want to remove the file corresponding to the incorrect space group.
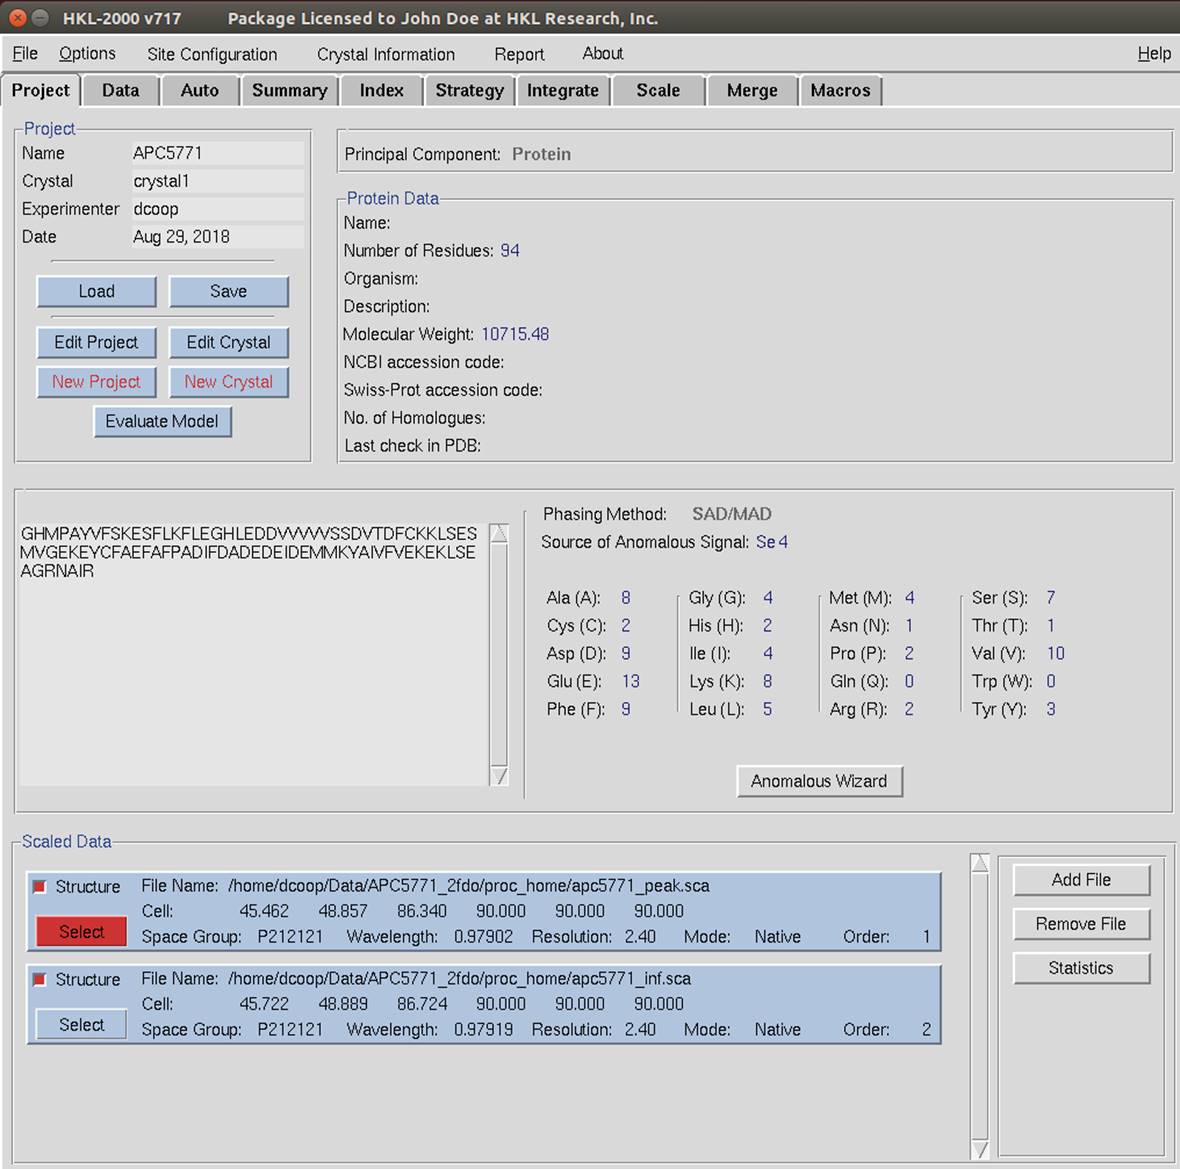
Figure 106. The Project Tab after scaling two data sets
You can use the Statistic button to display the results associated with the selected file. This display also includes a show log button that will display the log file associated with the scaling.
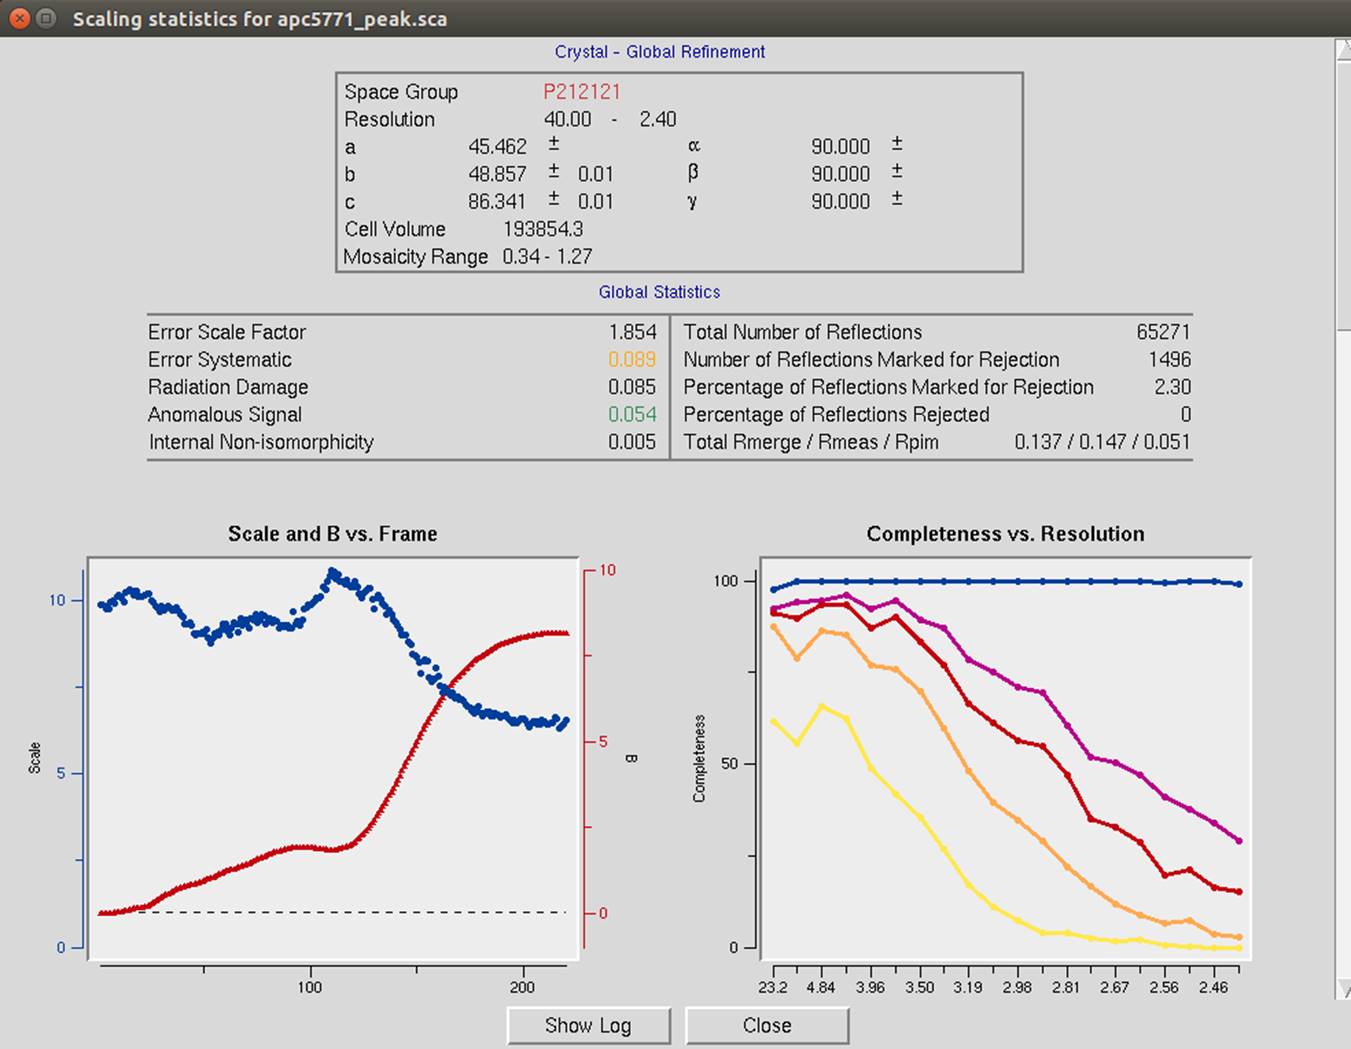
Figure 107. Use the Statistics button to see scaling results
|
HKL-2000 Online Manual |
||
|
Previous Output Statistics and Graphs |
Table of Contents | |