|
HKL-2000 Online Manual |
||
|
Previous Create, Load, and Save Projects |
Table of Contents | |
Display and Peak Search the Data
The HKL suite now includes two XDisp programs. The default program is the newer version, XDispQt. You can select the older version, XDispX, using the XDisp selector located in the Options menu.
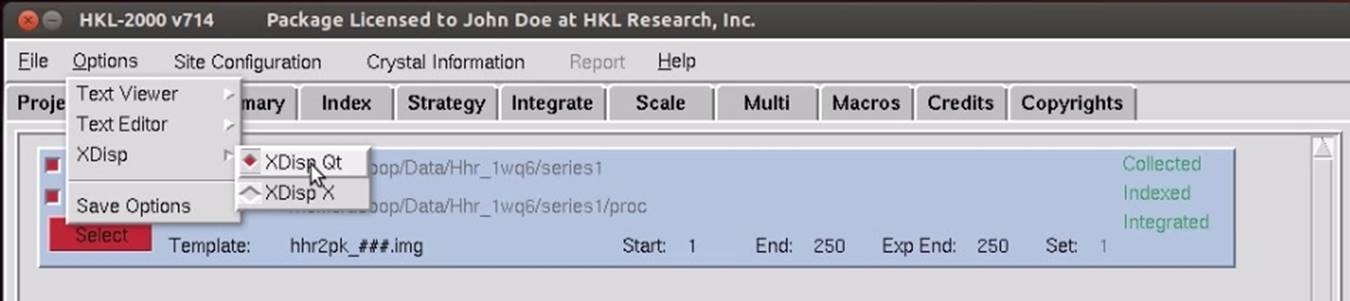
Figure 40. The XDisp selector
There are three ways to display your images. The most convenient method is the display button (Figure 41) in the Data tab. There is also a display button in the Index tab. Both of the display buttons have an adjacent frame selector box next that allows you to select a particular frame to view. The default frame is the first frame of the set.
![]()
Figure 41. The Display image button in the data tab
The layout of XDispQt opens with the image displayed in the center window (see Figure 42. The XDispQt display). You can zoom and scroll in this window to see more details of the image. Action buttons and display altering buttons are located on the left. A small view of the image, information about the cursor position, and an intensity histogram are located on the right. The XDispQt window can also be resized using standard window manipulation methods. Many modern Linux systems allow you to "Alt-middle-click and drag" to resize a window (some systems use "Ctrl-middle-click"). For this, your mouse just needs to be inside the window somewhere near a corner, which is usually much easier than either clicking and dragging the exact edge or right-clicking in the window's top panel and selecting "resize."
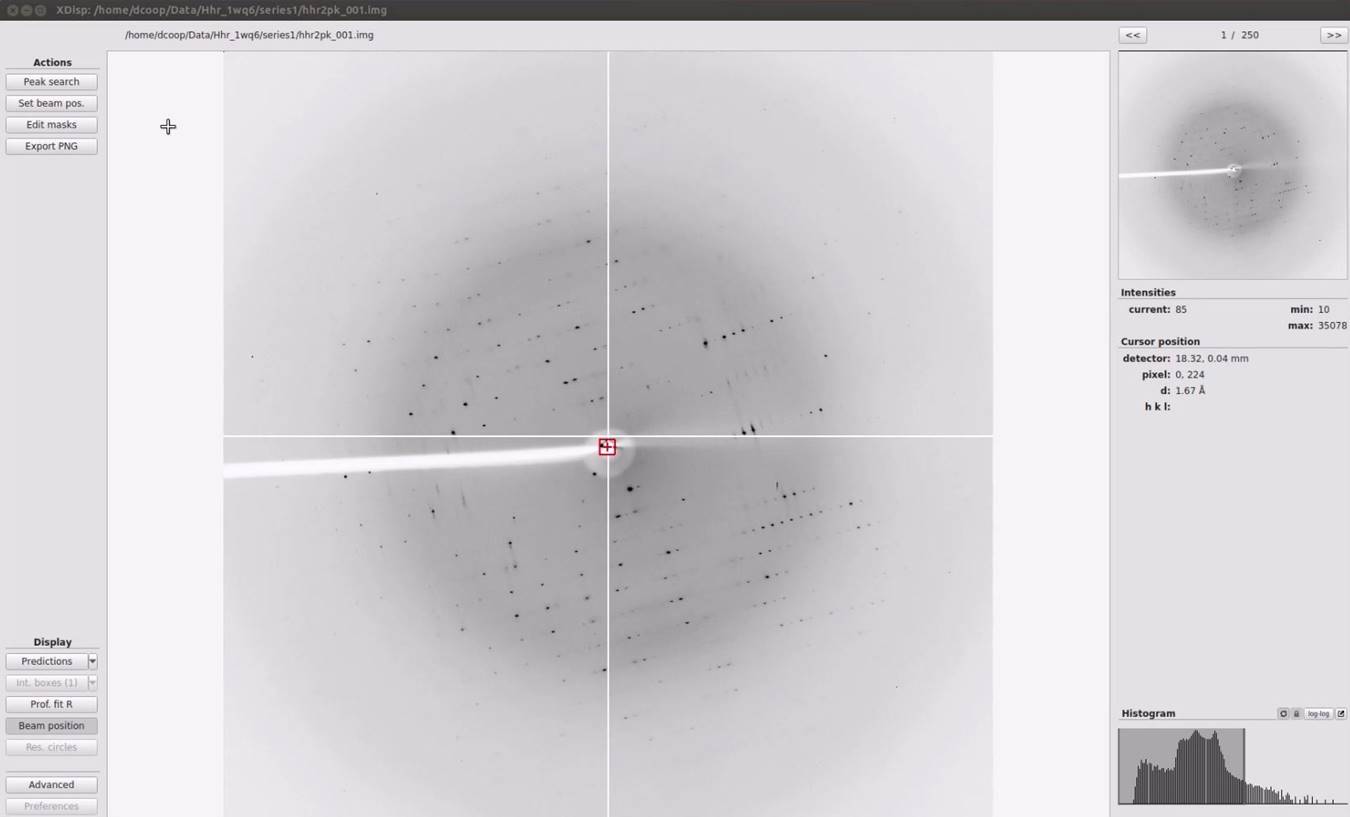
Figure 42. The XDispQt display
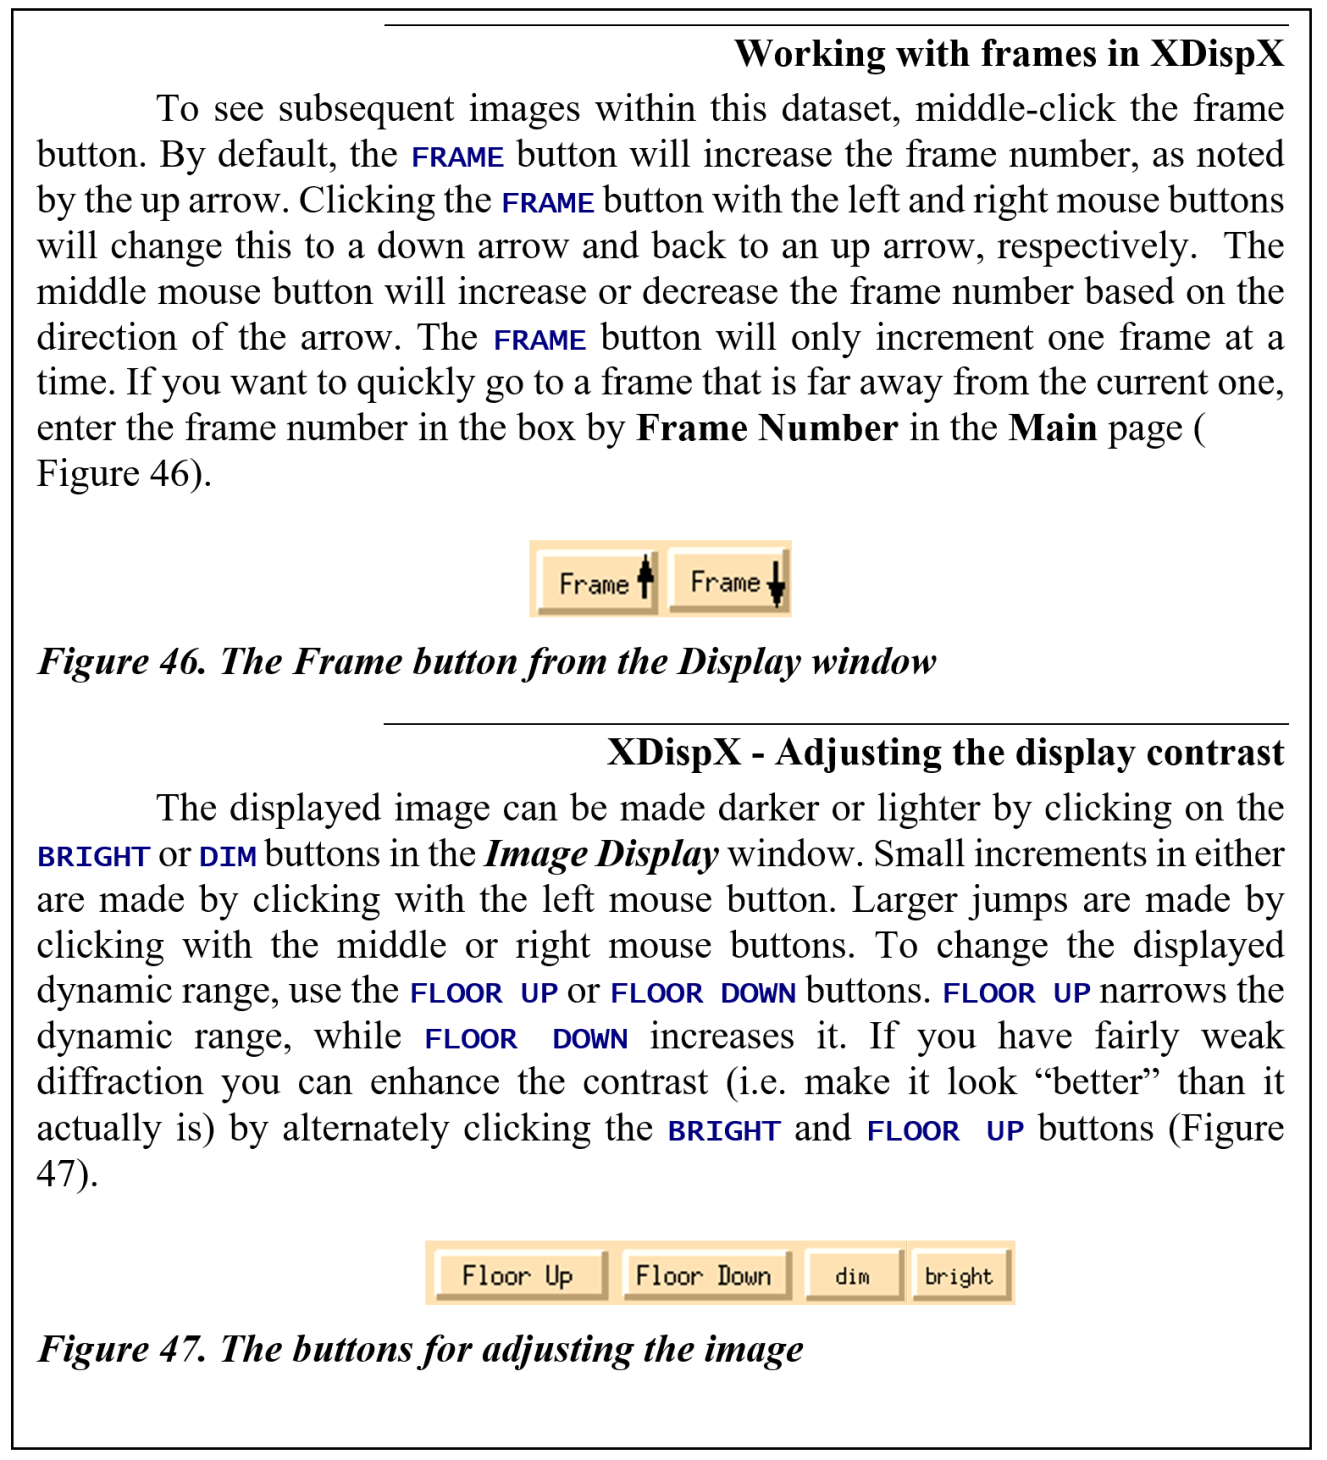
To view different frames, use the frame up ">>" and frame down "<<".
Zooming and selecting areas to view are controlled by the mouse. Zoom in using the mouse wheel. Once zoomed in, you can click-and-drag within the main display to move around. You may also click-and-drag the black frame representing the current view in the whole-image display on the top right. Zoom in far enough and the numeric intensity value for each pixel will be displayed. Click and drag with the right mouse button to show a cross-hair and intensity distribution for the vertical and horizontal lines displayed on their respective axis.
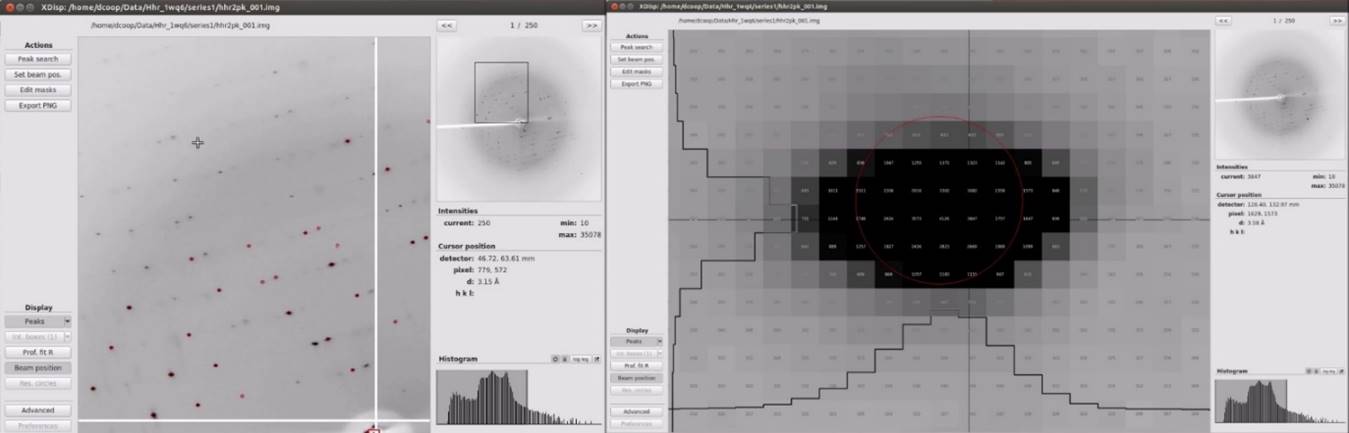
Figure 43. Two zoom levels are shown
The frame up and frame down arrows are on the top right of XDispQt (Figure 44). Change the intensity maximum and minimum using the intensity histogram on the bottom right (Figure 45). Click and drag the shaded box to change the range of intensities or drag an edge when it turns yellow to change just the maximum or minimum intensity. If your screen update is too slow, turn off the automatic refresh button (the cycle button next to the word "Histogram").
Figure 44. Frame up and down buttons
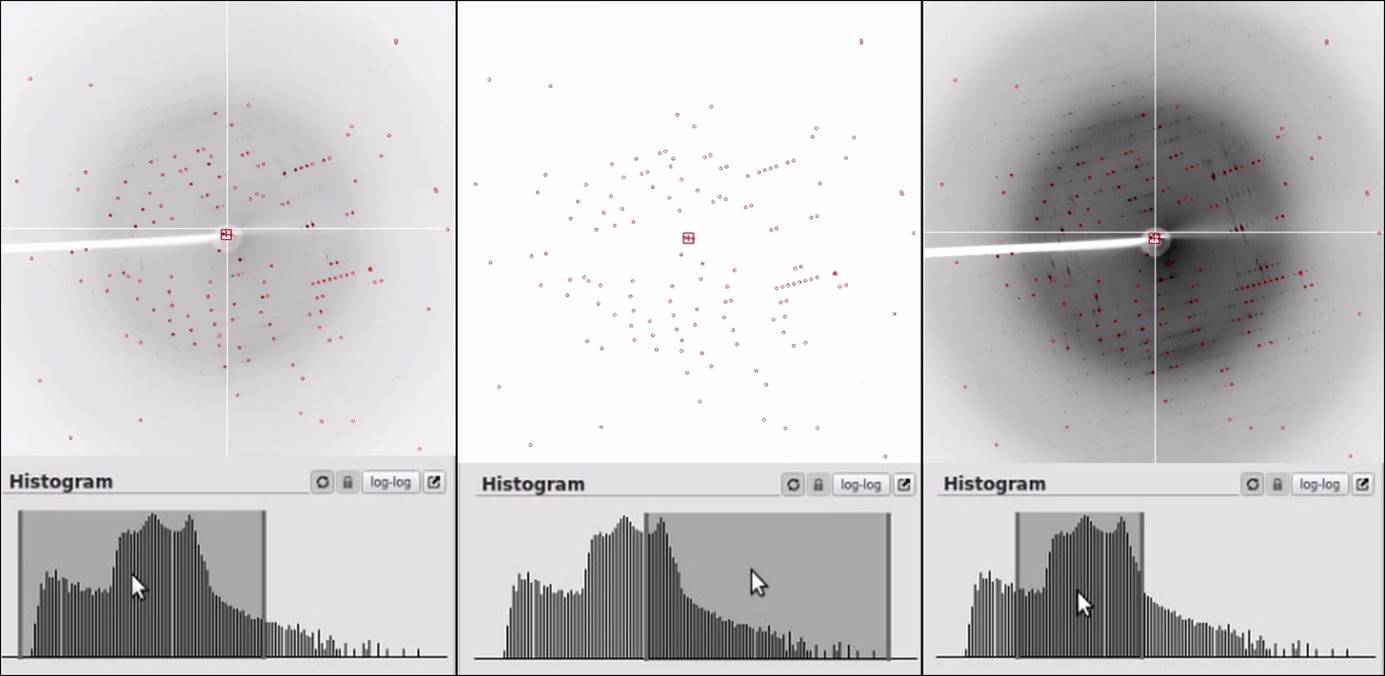
Figure 45. The Histogram controls the display contrast.
Automatic Peak Search
The default peak selection parameters of HKL are very often sufficient for indexing diffraction images, so if your image looks reasonable, you should give automatic peak search a try. To use this feature, switch to the Index tab, and click peak search. If you haven't displayed the image yet, this feature will open the display for you and peaks will automatically be selected. The selected peaks will be indicated by red circles. If at least 100 peaks are selected using the automatic peak search, you can skip to the indexing step.
Manual Peak Searches
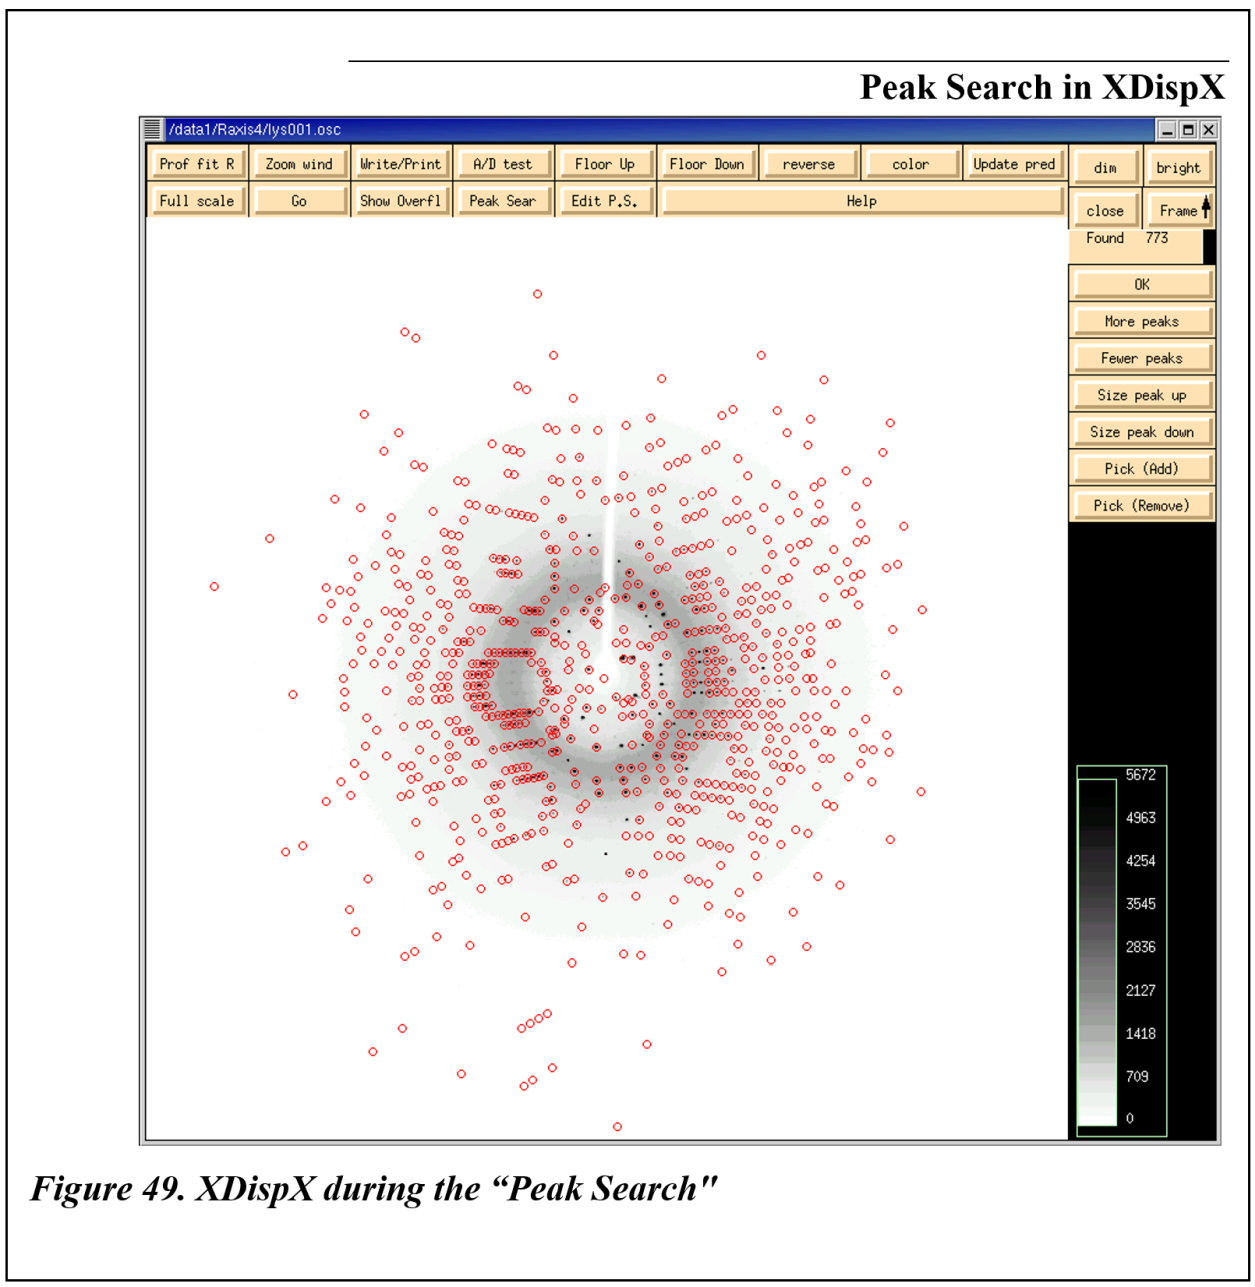
In some cases (weak data, noisy data, multiple crystals, etc.), the automatic peak search may not work as well as a manual search. In these cases, display an image and click peak search. Peaks will be selected based on their intensity, and a dialog box will appear on the right side of the image display. The goal of the peak search is to pick peaks for auto-indexing, and around 100 peaks should be sufficient if they clearly belong to the major lattice (i.e., not from a second crystal or ice rings). Sometimes the number of peaks will be low. In most cases, you can increase the number of peaks using the more peaks button. If you click more peaks too many times (especially with weak data), noise peaks will be selected, and you should decrease the number of peaks using Fewer peaks. Sometimes the peaks will not be selected if they are too large (or small) for the default peak search size. In these cases, the Bigger peaks or Smaller Peaks (size peak up or size peak down in XDispX) buttons will allow more peaks to be selected.
Another way of adding more peaks to the peak list is to include peaks from multiple frames. To do this, middle-click on the ">>" button (frame up in XDisp QT) button to display the next frame, and the peak search will be repeated on the next frame using the same criteria (e.g., more peaks, fewer peaks, etc.). These peaks will be added to the peak search from the first frame. This is a way to index poorly diffracting crystals and may help with certain crystal orientations.
When you are satisfied with the peak search results, click finish on the bottom left (ok in XDispQt) (Figure 48).
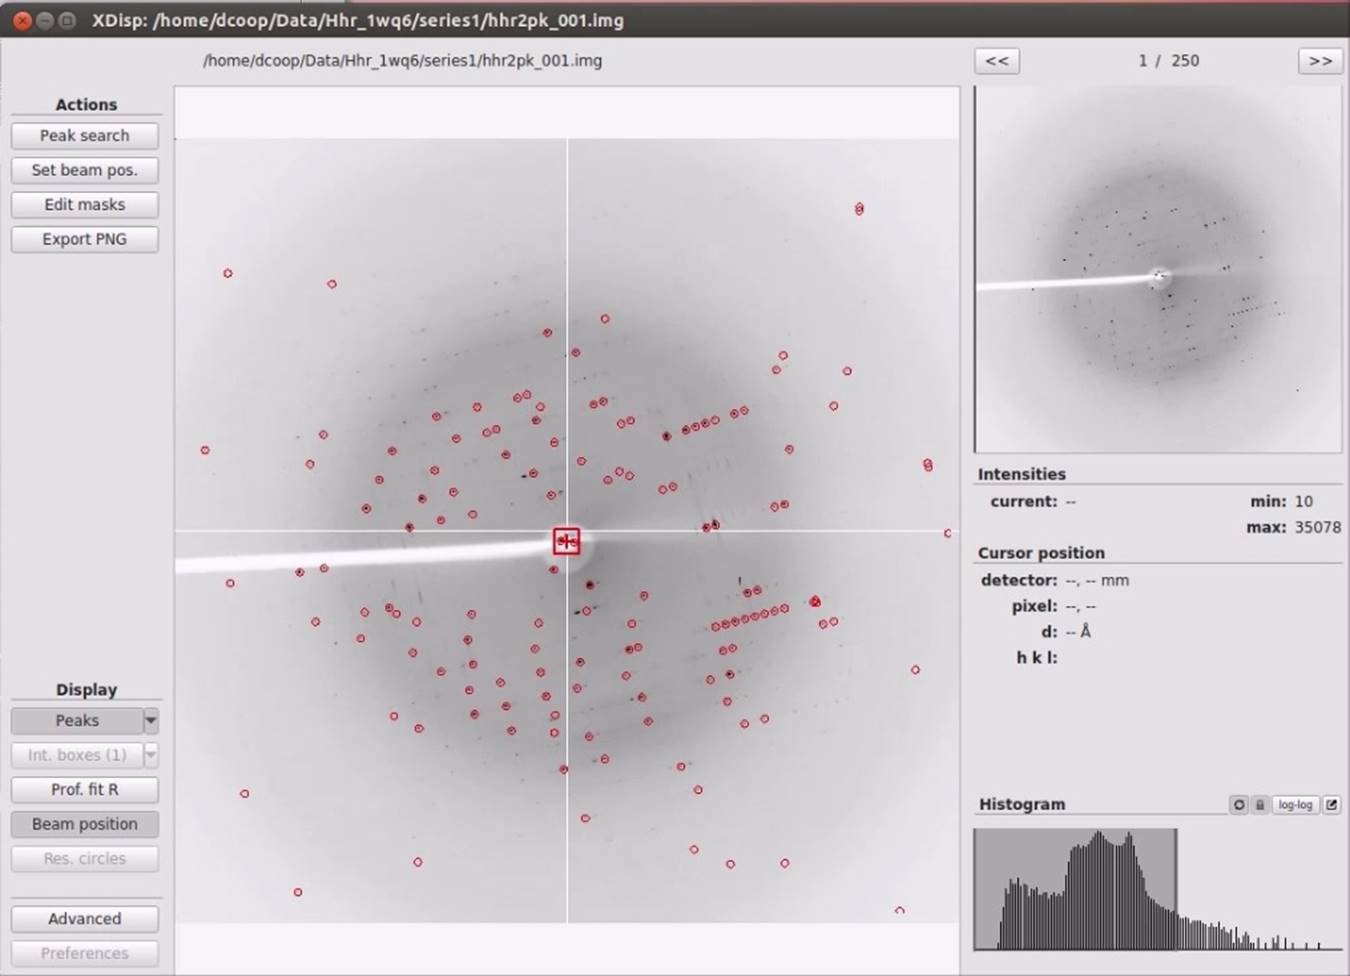
Figure 48. After peak search
Secondary Lattices
Denzo, the HKL suite program that indexes the data, assesses the quality of each peak before using it in auto-indexing, so most spurious peaks, such as those coming from ice rings, can be ignored by the user. However, if you have a second distinct lattice contaminating the diffraction pattern, you will have to make some effort to assure that the selected peaks come mainly from the primary lattice. The first way is to see if Denzo can automatically distinguish between the primary lattice and any secondary lattices. If the secondary lattice is weak or at a significantly different orientation from the primary lattice, this is not unreasonable. Alternatively, you can try indexing on a different frame, where the secondary lattice may not be so pronounced. However, if this does not work, you can assist the program by editing the peak search list in the Image Display window, as described below.
Adding and Removing Peaks
The presence of multiple crystals, cracked crystals, bent crystals, and certain types of twinned data can give rise to multiple diffraction patterns. These problems may only exist in sections of your data, or it may be persistent throughout the data. If it is only part of the data, see the Peak Search on Different Frames section. If the peak search process identifies reflections from more than one crystal, you may find it difficult or impossible to index and process the data. If you clearly have one diffraction pattern that diffracts stronger than the other, you may isolate the primary lattice by adjusting the sigma level of the reflections used in indexing. If this doesn't work, HKL provides you with the ability to change the results of a peak search manually. Add peaks that seem to be part of the primary lattice and remove peaks that don't. (If the crystal survives, it may be interesting to go back and use manual peak picking to characterize and possibly collect the "sister crystal.")
To perform a manual peak search, use the peak search button in the top left. The buttons More Peaks, Fewer Peaks, Bigger Peaks, and Smaller Peaks work as described above, and have a pop-up description if you hover over the buttons. Use the frame up button to increase the number of frames that will be included in the peak search.
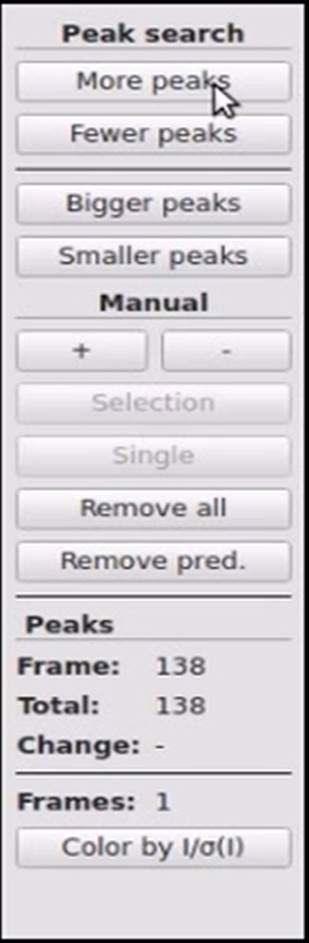
Figure 50. Peak Search options.
If you want to change the peaks that are picked manually, use the + and - buttons to add or remove peaks. Once the + button has been selected, click on reflections to add them to the peak list. With the - button, you can either remove reflections one at a time (Single will be selected as default) or use the selection button to define a rectangle of reflections to be removed from the peak list. To use this feature, click selection then and click twice (not click-and-drag) to define a region you wish to omit.
You also have the options of removing all the peaks so you can start over or coloring the peaks by their I/σ levels. Reset, Cancel, and Finish buttons are located at the bottom left. When performing a manual peak search, it is important to click the Finish button to save the peaks to a file so they can be used for indexing.
Peak search on different frames.
Sometimes it is advantageous to index on a frame other than the first frame. This can be helpful if a crystal axis is closely aligned with the X-ray beam. Choosing a frame with easily recognizable diffraction loons may help index your data. There are two ways to index your data on a different frame. The first way is to change the frame specified next to the peak [DRC1] search button in the Index tab. After setting the frame number, use the peak search button to conduct an automatic peak search. Changing the peak search frame selection will automatically change the frame used for indexing.
The second method of peak searching on a different frame is to divide the data into multiple sets using the split set button, as described above. This method will allow you to perform a manual peak search if you would like. Select the set that starts with the desired frame and conduct a peak search. If you do split the sets, be sure the select the proper set in the Pending Sets box of the Index tab before indexing, or you will get an error message that says, "Error -- Peaks none."
|
HKL-2000 Online Manual |
||
|
Previous Create, Load, and Save Projects |
Table of Contents | |